3

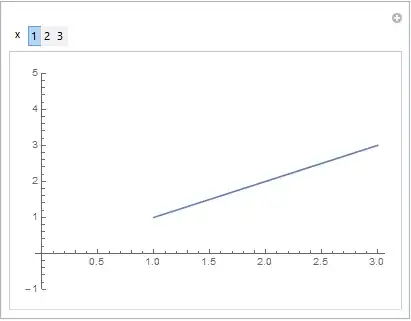
I have multiple curves in my plot, and want to be able to toggle their visibility off/on. Which I got to work thanks to a different post.

data = {{1, 2, 3}, {2, 5}, {0, 6}};
Manipulate[ListPlot[data,
Joined -> True, PlotRange -> {-1, 5},
PlotStyle -> {Opacity[a], Opacity[b], Opacity[c]}],
{{a, 1, "f1"}, {1, 0}}, {{b, 1, "f2"}, {1, 0}}, {{c, 1, "f3"}, {1, 0}}]

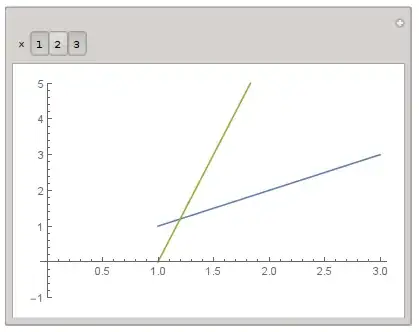
My dataset is not always of the same dimensions though. So depending on the data loaded I might have only two graphs next time I run my notebook.

data= {{1, 3}, {0, 2}}

Is there a nice way to make my code automatically adjust to the number of graphs?

I think i could make this work using Table and Length[data], but it feels as if there is a simpler and nicer way.

I'd appreciate any help!

Sjoerd C. de Vries
  • 65,815
  • 14
  • 188
  • 323
Jason
  • 119
  • 1
  • 5

2 Answers2

3
data = {{1, 2, 3}, {2, 5}, {0, 6}};
Manipulate[
 ListPlot[data[[x]], Joined -> True, PlotRange -> {-1, 5}], 
 {{x, {1}}, Range@Length@data, ControlType -> TogglerBar}
]

Mathematica graphics

With more togglers toggled:

Mathematica graphics

With differently size data

data = {{1, 2, 3}, {2, 5}};
Manipulate[
 ListPlot[data[[x]], Joined -> True, PlotRange -> {-1, 5}], 
 {{x, {1}}, Range@Length@data, ControlType -> TogglerBar}
]

Mathematica graphics

Sjoerd C. de Vries
  • 65,815
  • 14
  • 188
  • 323
3

You can set up list of opacities automatically

data = {{1, 2, 3}, {2, 5}, {0, 6}};
Manipulate[ListPlot[data, Joined -> True, PlotRange -> {-1, 5}, 
  PlotStyle -> (Opacity@Boole@MemberQ[x, #] & /@ Range@Length@data)], 
    {{x, {1}}, Dynamic@Range@Length@data, ControlType -> TogglerBar}]

enter image description here

ybeltukov
  • 43,673
  • 5
  • 108
  • 212
  • This has the disadvantage that if you copy the figure for use elsewhere it stores all the data of invisible plots. ;-) – Sjoerd C. de Vries Jan 14 '15 at 16:51
  • @SjoerdC.deVries You can add /. {___, _@_Opacity, ___} -> {} after the ListPlot :-) – ybeltukov Jan 14 '15 at 17:11
  • This is it! Perfect, thank you! Both suggested solutions work. I preferred this one, since it's loading all graphs simultaneously and only toggles their opacity. I'm hoping this way is a bit faster when working with a lot of graphs at the same time. Thanks again to both of you! – Jason Jan 14 '15 at 18:52
  • I'd love to vote both of you up, but can't yet due to missing reputation. – Jason Jan 14 '15 at 18:55