4

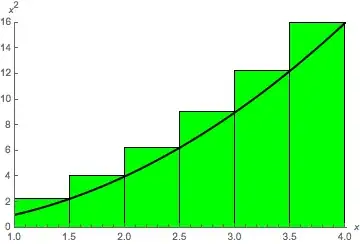
I want to graph the Riemann sum (upper sum) of $y=x^2$ with $1\leq x\leq 4$ using 6 rectangles. I want the rectangles to be green.

On the Wolfram Mathworld website, I can render exactly what I want and I get the following: enter image description here

Now, I am trying to render exactly the same thing in Mathematica itself, but I have absolutely no idea what to do.

I already tried using the following code:

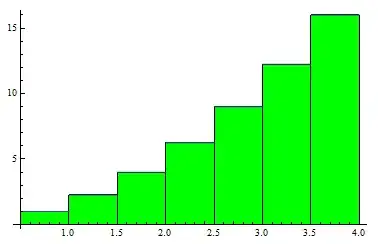
Show[DiscretePlot[x^2, {x, 1, 4, 0.5}, ExtentSize -> Left], Plot[x^2, {x, 0, 4}]]

which renders the following:

enter image description here

How should I modify my code to get the picture that the Wolfram Alpha website renders? Thanks in advance.

  • Before asking a question search for similar questions (to avoid possible duplicates, it is one by the way), then register your account. After all, you are welcome! – Artes Jan 18 '15 at 14:56
  • 1
    If you check the examples on the documentation page of DiscretePlot, you'll find lots and lots which change the styling. Have you looked at these? – Szabolcs Jan 18 '15 at 14:59
  • Yes I did, and I was able to change the color to green, but I was not able to find out how the bordering works and how to set the domain to $1\leq x\leq 4$. Could you please help a bit? – mathematicanewbie123 Jan 18 '15 at 15:08
  • Do you get what you need if you use BaseStyle-> EdgeForm[Black] in Show? Alternatively, BaseStyle-> EdgeForm[Black] or PlotStyle-> EdgeForm[Black] in DiscretePlot? – kglr Jan 18 '15 at 15:47
  • 1
    Sure, but you need to be very specific with your questions. In your original question you seem to be asking about how to make it green, but it turns out you already know how to do this. Then in a comment you ask a completely different question about changing the domain and the borders. Can you edit your question, show what you have so far, and explain precisely what is missing? – Szabolcs Jan 18 '15 at 15:49
  • Please do change the link, you're not on Wolfram Alpha but on WolframMathWorld. WolframMathWorld. –  Jan 18 '15 at 17:17

3 Answers3

8

Here is another way using a different set of DiscretePlot's options.

Show[
  DiscretePlot[x^2, {x, 1, 4, 0.5},
    PlotRange -> {{1, 4.01}, {0, 16.01}},
    PlotRangeClipping -> True,
    AxesLabel -> {x, x^2},
    Ticks -> {Automatic, Range[0, 16, 2]},
    ExtentSize -> Left,
    ColorFunction -> (Green &),
    ExtentElementFunction -> ({EdgeForm[Black], Rectangle @@ Transpose @ #} &)],
  Plot[x^2, {x, 0, 4}, PlotStyle -> {Black, Thick}]]

plot

m_goldberg
  • 107,779
  • 16
  • 103
  • 257
4

This is nontrivial due to PlotRangeClipping, FaceForm, FaceForm, etc.

Show[
 DiscretePlot[x^2, {x, 1, 4, 0.5}, ExtentSize -> Left,
  PlotRange -> {{1, 4}, {0, 16}}, 
  PlotStyle -> Directive[Black, FaceForm[{Opacity[1], Green}], EdgeForm[Black]], 
  Ticks -> {Automatic, Range[2, 16, 2]}],
 Plot[x^2, {x, 0, 4}, PlotStyle -> Directive[AbsoluteThickness[3], Black]],
 PlotRangeClipping -> True,
 BaseStyle -> EdgeForm[Black],
 AxesLabel -> {"x", "\!\(x\^2\)"}
]

enter image description here

Mr.Wizard
  • 271,378
  • 34
  • 587
  • 1,371
3

To render the filling rectangles with black edges, you can use the option FillingStyle with EdgeForm[Black]:

Show[DiscretePlot[x^2, {x, 1, 4, 0.5}, ExtentSize -> Left,
  FillingStyle -> Directive[Opacity[1], Green, EdgeForm[Black]]],
 Plot[x^2, {x, 0, 4}, PlotStyle -> Directive[Thick, Black]]]

enter image description here

You can also use Epilog in DiscretePlot to have all graphics primitives in a single plot:

DiscretePlot[x^2, {x, 1, 4, 0.5}, ExtentSize -> Left, 
 FillingStyle -> Directive[Opacity[1], Green, EdgeForm[Black]],
 Epilog ->  Plot[x^2, {x, 0, 4}, PlotStyle -> Directive[Thick, Black]][[1]]] 
(* same picture *)

Update: in version 9,

dp = DiscretePlot[x^2, {x, 1, 4, 0.5}, ExtentSize -> Left,
  PlotStyle -> Directive[{EdgeForm[Black], FaceForm[{Green, Opacity[1]}]}]]

renders the rectangles with Opacity[.2`]

enter image description here

dp[[1]]

enter image description here

Adding the option FillingStyle->Opacity[1] gives the correct opacity for the rectangles:

DiscretePlot[x^2, {x, 1, 4, 0.5}, ExtentSize -> Left, 
 FillingStyle -> Opacity[1],
 PlotStyle -> Directive[{EdgeForm[Black], FaceForm[{Green, Opacity[1]}]}]]

enter image description here

Alternatively, you can post-process to remove the Opacity[.2`] directive:

dp /. Opacity[.2`] -> Sequence[]
(* same picture *)
kglr
  • 394,356
  • 18
  • 477
  • 896