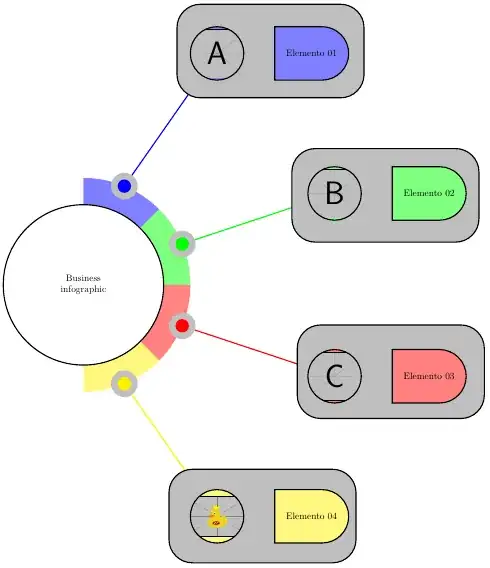
A simple sketch is presented below. It uses the style named figNode/.style to insert an image inside a node, so you can control how the outside border will interact with your figure and it also uses somes foreachs loops to write a little bit more compact some syntaxes. Other elements were just positioned somewhere to resemble your original concept.
It still needs some improvements with:
- shading,
- better positioning,
- replacing connections between central half circle and the four element blocks, and
- the rectangle-like form with elements.
The following MWE is just a starting point.
\documentclass[border=5pt]{standalone}
\usepackage{tikz}
\usetikzlibrary{positioning,shapes.misc}
\tikzset{
  figNode/.style={
    path picture={
      \node at (path picture bounding box.center) {#1};}}
}
\begin{document}
\begin{tikzpicture}[very thick]
  \node (a) at (60:10){};
  \node (b) at (20:10){};
  \node (c) at (-20:10){};
  \node (d) at (-60:10){};
\foreach \r/\c in {90/blue,45/green,0/red,-45/yellow}{
    \fill[\c!50] (0,0) -- (\r:4) arc (\r:\r-45:4) -- cycle;
  };
\foreach \r/\c/\p in {67.5/blue/a,22.5/green/b,-22.5/red/c,-67.5/yellow/d}{
    \draw[\c] (\r:4) -- (\p);
    \fill[gray!50] (\r:4) circle (0.5);
    \fill[\c] (\r:4) circle (0.25);
  };
\draw[fill=white] (0,0) circle (3) node[align=center]{Business \ infographic};
\draw[rounded corners=25pt, fill=gray!50] (3.5,7) rectangle ++(7,3.5);
  \draw[fill=blue!50, figNode={\includegraphics[width=0.2\textwidth]{example-image-a}}]
    (a) circle (1);
  \node[right=2 of a, rounded rectangle=25pt, rounded rectangle west arc=none, draw, fill=blue!50,
    minimum height=2cm, minimum width=3cm] {Elemento 01};
\draw[rounded corners=25pt, fill=gray!50] (7.8,1.6) rectangle ++(7,3.5);
  \draw[fill=green!50, figNode={\includegraphics[width=0.2\textwidth]{example-image-b}}]
    (b) circle (1);
  \node[right=2 of b, rounded rectangle=25pt, rounded rectangle west arc=none, draw, fill=green!50,
    minimum height=2cm, minimum width=3cm] {Elemento 02};
\draw[rounded corners=25pt, fill=gray!50] (8,-5) rectangle ++(7,3.5);
  \draw[fill=red!50, figNode={\includegraphics[width=0.2\textwidth]{example-image-c}}]
    (c) circle (1);
  \node[right=2 of c, rounded rectangle=25pt, rounded rectangle west arc=none, draw, fill=red!50,
    minimum height=2cm, minimum width=3cm] {Elemento 03};
\draw[rounded corners=25pt, fill=gray!50] (3.2,-10.4) rectangle ++(7,3.5);
  \draw[fill=yellow!50, figNode={\includegraphics[width=0.2\textwidth]{example-image-duck}}]
    (d) circle (1);
  \node[right=2 of d, rounded rectangle=25pt, rounded rectangle west arc=none, draw, fill=yellow!50,
    minimum height=2cm, minimum width=3cm] {Elemento 04};
\end{tikzpicture}
\end{document}
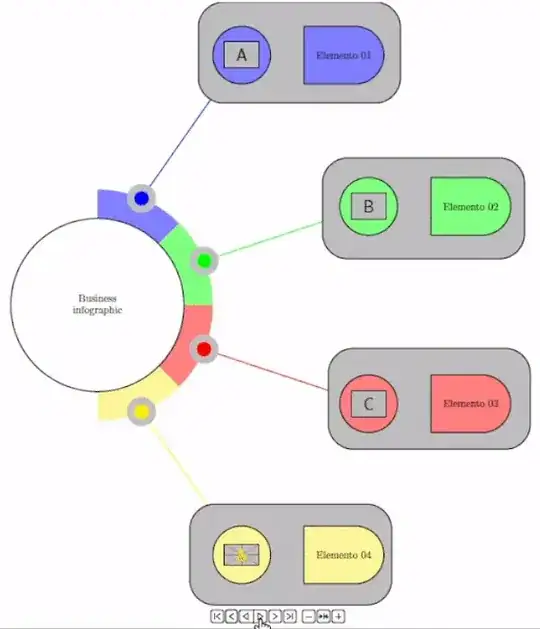
Update and animation
Some time ago I asked a question about Best method to animate a step by step state space diagram construction in TikZ.
Now I can provide a new solution to the original question. I can show now how to create a PDF-embedded animation.
The command \uncover was provided by @AlexG and is the key for this technique to work.
The MWE and a gif follow
\documentclass[border=5pt]{standalone}
\usepackage{tikz}
\usepackage[autoplay,controls,loop]{animate}
\usetikzlibrary{positioning,shapes.misc}
\tikzset{
  figNode/.style={
    path picture={
      \node at (path picture bounding box.center) {#1};}}
}
% ==== Command used to uncover frames to provide an animated result
\newcommand\uncover[3]{\ifnum#1<#2\phantom{#3}\else#3\fi}
% ====
\begin{document}
\begin{animateinline}[controls,loop,poster=last,begin={
    \begin{tikzpicture}[scale=1,very thick]
      \useasboundingbox (-3.5,-10.5) rectangle (16,10.5);
    },
    end={\end{tikzpicture}}
  ]{2}
  \multiframe{14}{i=0+1}{
    \node (a) at (60:10){};
    \node (b) at (20:10){};
    \node (c) at (-20:10){};
    \node (d) at (-60:10){};
\foreach \r/\c/\q in {90/blue/2,45/green/5,0/red/8,-45/yellow/11}{
  \uncover{\i}{\q}{
    \fill[\c!50] (0,0) -- (\r:4) arc (\r:\r-45:4) -- cycle;
  }
};

\foreach \r/\c/\p/\q in {67.5/blue/a/3,22.5/green/b/6,-22.5/red/c/9,-67.5/yellow/d/12}{
  \uncover{\i}{\q}{
    \draw[\c] (\r:4) -- (\p);
    \fill[gray!50] (\r:4) circle (0.5);
    \fill[\c] (\r:4) circle (0.25);
  }
};

\uncover{\i}{1}{\draw[fill=white] (0,0) circle (3) node[align=center]{Business \\ infographic};}

\uncover{\i}{4}{
  \draw[rounded corners=25pt, fill=gray!50] (3.5,7) rectangle ++(7,3.5);
  \draw[fill=blue!50, figNode={\includegraphics[width=0.1\textwidth]{example-image-a}}] (a) circle (1);
  \node[right=2 of a, rounded rectangle=25pt, rounded rectangle west arc=none, draw, fill=blue!50,
  minimum height=2cm, minimum width=3cm] {Elemento 01};
}

\uncover{\i}{7}{
  \draw[rounded corners=25pt, fill=gray!50] (7.8,1.6) rectangle ++(7,3.5);
  \draw[fill=green!50, figNode={\includegraphics[width=0.1\textwidth]{example-image-b}}] (b) circle (1);
  \node[right=2 of b, rounded rectangle=25pt, rounded rectangle west arc=none, draw, fill=green!50,
  minimum height=2cm, minimum width=3cm] {Elemento 02};
}

\uncover{\i}{10}{
  \draw[rounded corners=25pt, fill=gray!50] (8,-5) rectangle ++(7,3.5);
  \draw[fill=red!50, figNode={\includegraphics[width=0.1\textwidth]{example-image-c}}] (c) circle (1);
  \node[right=2 of c, rounded rectangle=25pt, rounded rectangle west arc=none, draw, fill=red!50,
  minimum height=2cm, minimum width=3cm] {Elemento 03};
}

\uncover{\i}{13}{
  \draw[rounded corners=25pt, fill=gray!50] (3.2,-10.4) rectangle ++(7,3.5);
  \draw[fill=yellow!50, figNode={\includegraphics[width=0.1\textwidth]{example-image-duck}}] (d) circle (1);
  \node[right=2 of d, rounded rectangle=25pt, rounded rectangle west arc=none, draw, fill=yellow!50,
  minimum height=2cm, minimum width=3cm] {Elemento 04};
}

}
\end{animateinline}
\end{document}
 where the images in the small circles will be

