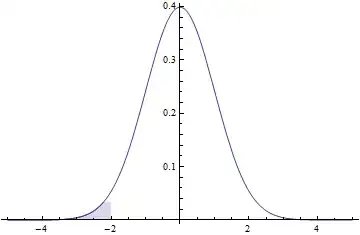
Another method:
With[{pdf = PDF[NormalDistribution[]], cv = -2.001},
 ParametricPlot[{x, t pdf[x]}, {x, -5, 5}, {t, 0, 1},
  MeshFunctions -> {#3 &}, Mesh -> {{cv}},
  MeshShading -> {Directive[Opacity[0.2], ColorData[1][1]], None},
  AspectRatio -> 1/GoldenRatio, PlotRange -> All, Frame -> False]
 ]

Two-tailed:
With[{pdf = PDF[NormalDistribution[]], cv = 2.001},
 ParametricPlot[{x, t pdf[x]}, {x, -5, 5}, {t, 0, 1},
  MeshFunctions -> {#3 &}, Mesh -> {{-cv, cv}},
  MeshShading -> {Directive[Opacity[0.2], ColorData[1][1]], None},
  AspectRatio -> 1/GoldenRatio, PlotRange -> All, Frame -> False]
 ]
Right-tailed (note the reversal of MeshShading):
With[{pdf = PDF[NormalDistribution[]], cv = 2.001},
 ParametricPlot[{x, t pdf[x]}, {x, -5, 5}, {t, 0, 1},
  MeshFunctions -> {#3 &}, Mesh -> {{cv}},
  MeshShading -> {None, Directive[Opacity[0.2], ColorData[1][1]]},
  AspectRatio -> 1/GoldenRatio, PlotRange -> All, Frame -> False]
 ]
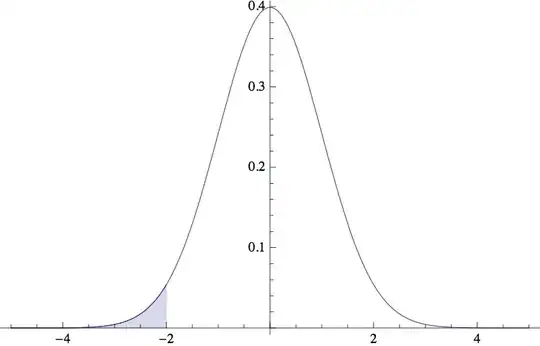
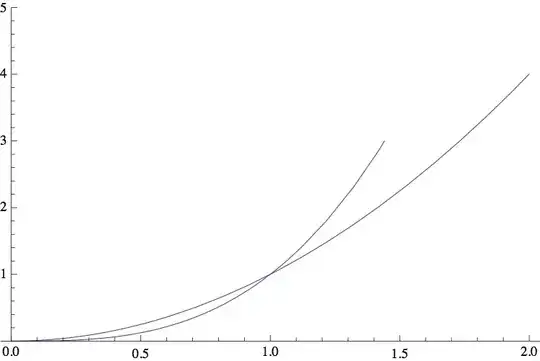
PlotRange->Allin your second graph which ensures that the whole curve is plotted. – halirutan May 14 '13 at 07:55With[{dist = PDF[NormalDistribution[], #] &}, Plot[{ConditionalExpression[dist[x], x < -2], dist[x]}, {x, -5, 5}, Filling -> {1 -> Axis}, PlotStyle -> ColorData[1, 1]]]– Pinguin Dirk May 14 '13 at 07:59PlotRange->Allinside your second plot, not in theShow. – halirutan May 14 '13 at 08:06Plot[1/x, {x, 0, 2}]withPlot[1/x, {x, 0, 2}, PlotRange -> All]. IfPlotRange -> Allwere the default people would surely complain about this example I gave. It is the default, so people complain about other examples. We can't eat the cake and have it too ;-) – Szabolcs May 14 '13 at 17:09