I have a similar question to this one. Unfortunately, the answers there didn't help me. I would like to plot a simple function with the normal Plot function. However, I want the origin of my plot to be in the upper left corner, the x-axes to grow to the right and the y-axes to grow down. How can I do this?
Asked
Active
Viewed 9,963 times
15
Alexander Popov
- 263
- 2
- 6
2 Answers
15
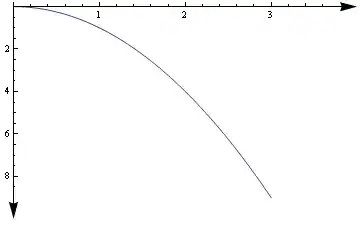
A little bit tricky because it is not supposed to work: ScallingFunctions are documented since V11 but this works for V10 and maybe erlier versions.
Plot[x^2, {x, 0, 3}, ScalingFunctions -> {Identity, "Reverse"},
                     PlotRange -> {{0, 4}, {-10, 0}},
                     AxesStyle -> {Arrowheads@.05, Arrowheads[{-.05, 0}]}]
Kuba
- 136,707
- 13
- 279
- 740
-
3
-
I wanted to suggest to post a separate question but it seems you've done this already. – Kuba Apr 03 '14 at 12:01
4
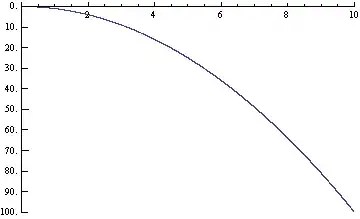
Not pretty, but using supported capabilities.
x = #^2 &@Range[0, 10, .001];

ListPlot[-x, DataRange -> {0, 10}, PlotStyle -> PointSize[.002],
 InterpolationOrder -> 2, PlotRange -> {{0, 10}, {0, -100}},
 AxesOrigin -> {0, 0},
 Ticks -> {Automatic,
   Function[{mn, mx},
    Table[{i, -i, {0.02, 0}}, {i, N@FindDivisions[{mn, mx}, 10]}]]}]
ciao
- 25,774
- 2
- 58
- 139
ScallingFunctionsis no longer working withListPlot, at least on V9.0.1.0 WinXP/Win7. – Kuba Jan 24 '14 at 10:13